Equity Betas for Listed Infrastructure Funds
The share prices of listed infrastructure funds demonstrate very low volatility vs the equity market as a whole. Unsystematic risk accounts for almost all of the total risk.
Equity betas of listed infrastructure funds are very low, which reflect the stable cash flows and low asset betas of the underlying projects. The analysis shows the volatility of fund share price returns relative to the FTSE 100.
With an average 5-year sector equity beta of 0.079, the share prices of listed infrastructure funds have very little correlation to the broader market and very low volatility vs. the broader market. Ninety-eight percent of this volatility is from unsystematic risk due to the sector’s low correlation to the business cycle. (1)
Portfolio risk from infrastructure debt can be diversified away more easily than portfolio risk from leveraged loans, where there is higher systematic risk and higher asset correlation (see “Infrastructure debt pairwise asset correlations,” March 2016).
Exhibit 1. Summary of infrastructure fund equity betas (β)
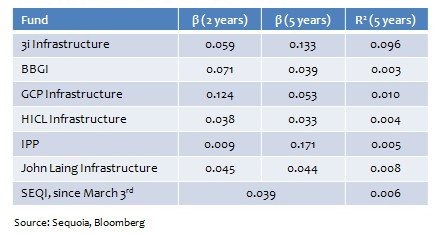
Exhibit 2. Standard deviation (σ) of returns

The scatter plot in Exhibit 3 shows weekly movements in GCP’s share price (vertical or y-axis) vs. weekly movements in the FTSE 100 (x-axis), with a line-of-best-fit (Characteristic Line) in red.
The beta (β), or the gradient of this line, and the R² statistic describe how close the distribution is to the line-of-best-fit. R² also measures the proportion of total risk that is systematic risk and 1-R² measures the proportion of total risk that is unsystematic risk. The average total risk of the sector (the variance) is 2.2%. Of this total, 2.1% is systematic risk and 97.9% is unsystematic risk. Conclusion: the low beta and the low amount of systematic risk demonstrate there is very little covariance between listed infrastructure funds and the broader equity market.
Exhibit 3. Five-year alpha and equity beta for GCP, a debt-focused infrastructure fund

The annualized alpha (α) in Exhibit 3 is positive at 2.86% (0.055 bps x 52) which we believe is a function of infrastructure debt’s decreasing marginal default probability over time not being recognized by the market. We expect Sequoia Economic Infrastructure Income Fund (SEQI) to have a higher alpha because economic infrastructure also benefits from growing revenues from increasing unit pricing and unit volume. This aspect of economic infrastructure debt is undervalued by the market.
1) Five-year equity beta, ex SEQI as outlier. This is the unlevered beta, which does not adjust for financial leverage and assumes similar operating leverage across funds. Some funds employ financial leverage of circa 20% of NAV.